Financial Analysis Tool
This FAQ will go over the Financial Analysis Tool in Paradigm ERP. This tool can be found by going to General Ledger > Financial Analysis Tool
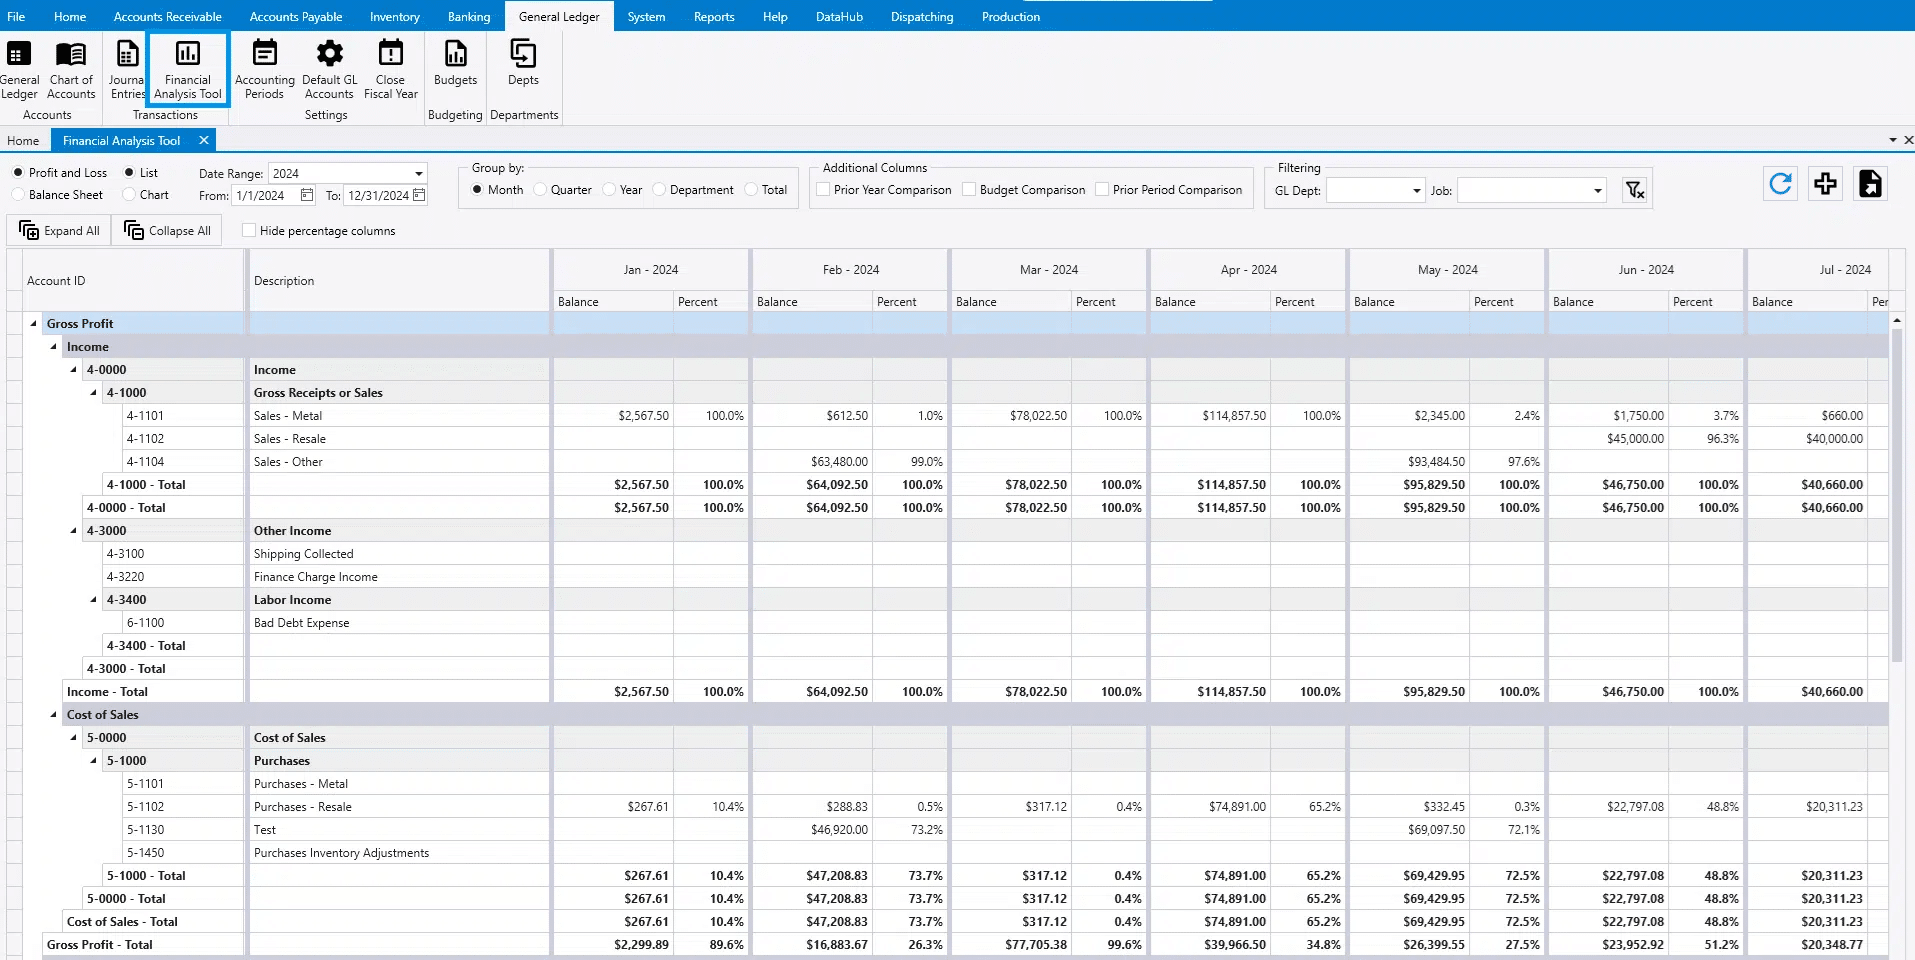
Double click on a number to see the GL entries that make up the total. Once that screen is open, click the folder icon to open the transaction.
Financial Analysis Tool

Report Type
- Profit and Loss – Displays the data in a profit & loss format.
- Balance Sheet – Displays the date in a balance sheet format.
Report Display
- List – Displays a list of all accounts.
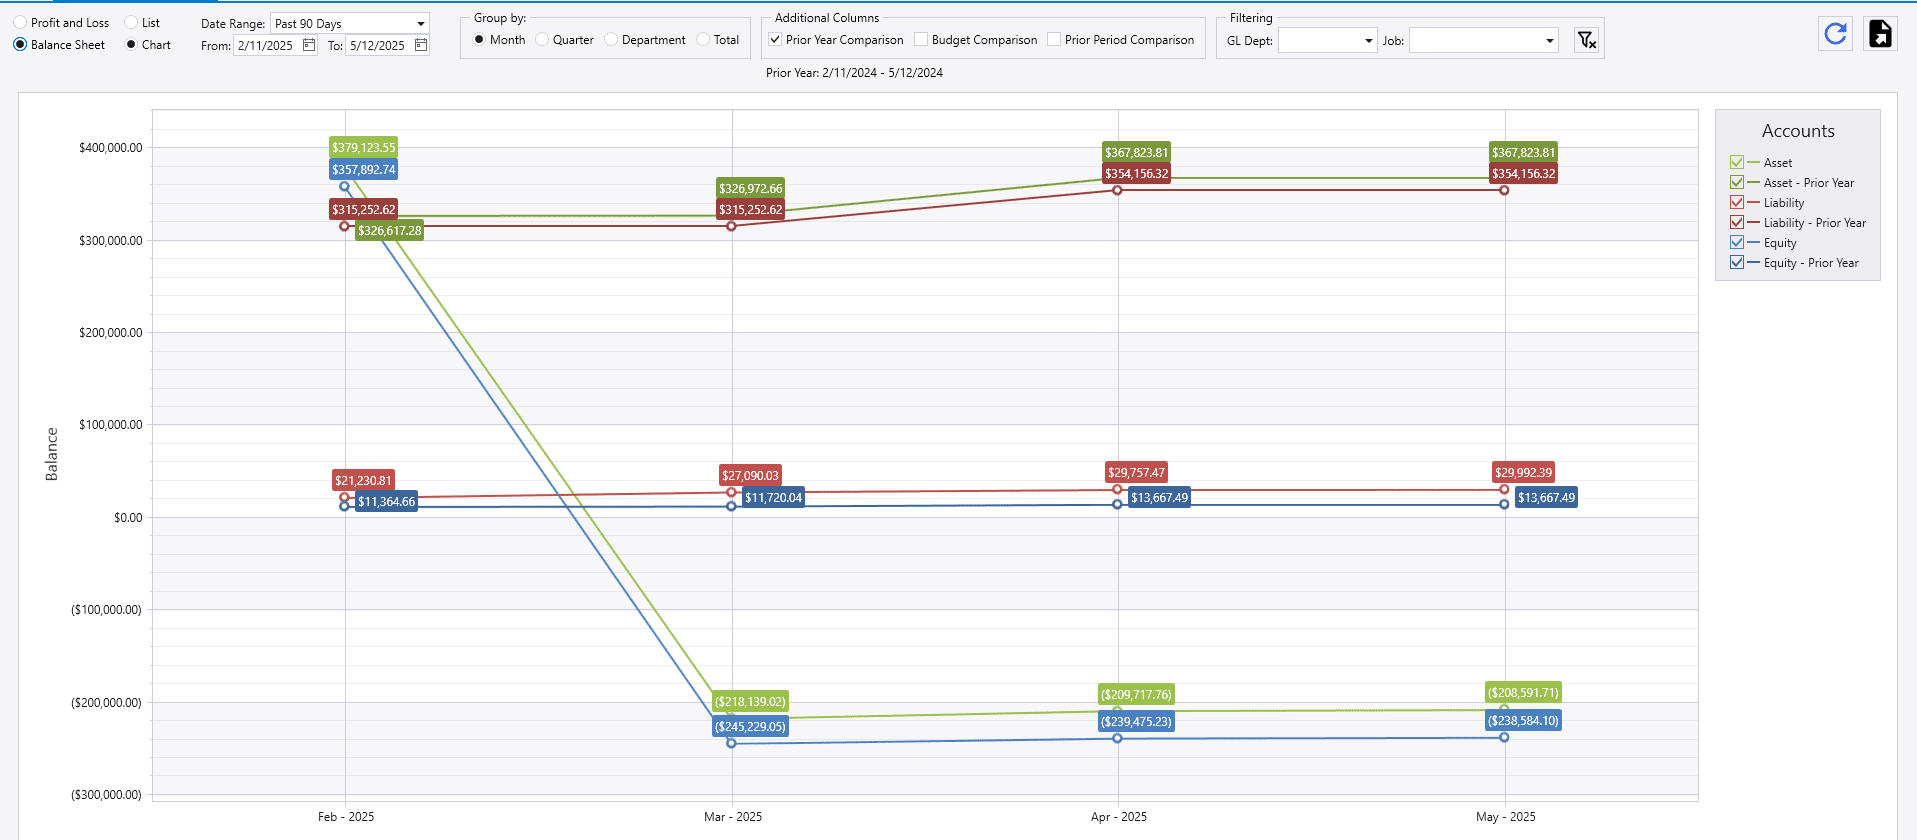
- Chart – Displays the header accounts on a chart.
Date Range
Select the date range for the data needed.

The arrows can be used for easy changes to the date.
- The single arrow will move the date range backward and forward by one day.
- The double arrows will move the date range backward and forward by one month.
- The triple arrows will move the date range backward and forward by one year.
Group By
Choose an option to group the columns by:
- Month
- Quarter
- Year
- Department
- Total
Additional Columns
- Prior year comparison – Compares against the prior year.
- Budget Comparison – Compares against the selected budget.
- Prior Period Comparison – Compares against the previous period.
- For example, if grouping by month it will compare against the previous month.
Filtering
- GL Dept – Filters the data to the selected department.
- Job – Filters the data to the selected job.
Refresh Button
- The refresh button can be used to update the data once the date range, group by, or any other setting is changed.
- Switching between Profit and Loss or Balance Sheet will automatically refresh the data.

Export Button
- The export button can be used to export the data into an excel sheet.


User Preferences
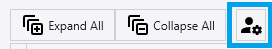
The “User Preferences” button is available only in the “List” display. Selecting the “User Preferences” button will trigger this pop-up:
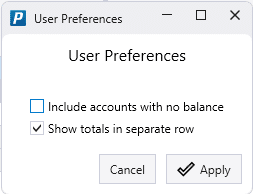
If new different preferences are selected, click “Apply” and then select “Refresh” to update the form to your preferences.
Include Accounts with no Balance
When checked this will include accounts that have no data to display.
Show Totals in Separate Row
When checked this preference will show totals for each account type in a new row. Otherwise totals will be displayed in the same row as the account type.