Charts
This FAQ will go over the available chart options in Paradigm.
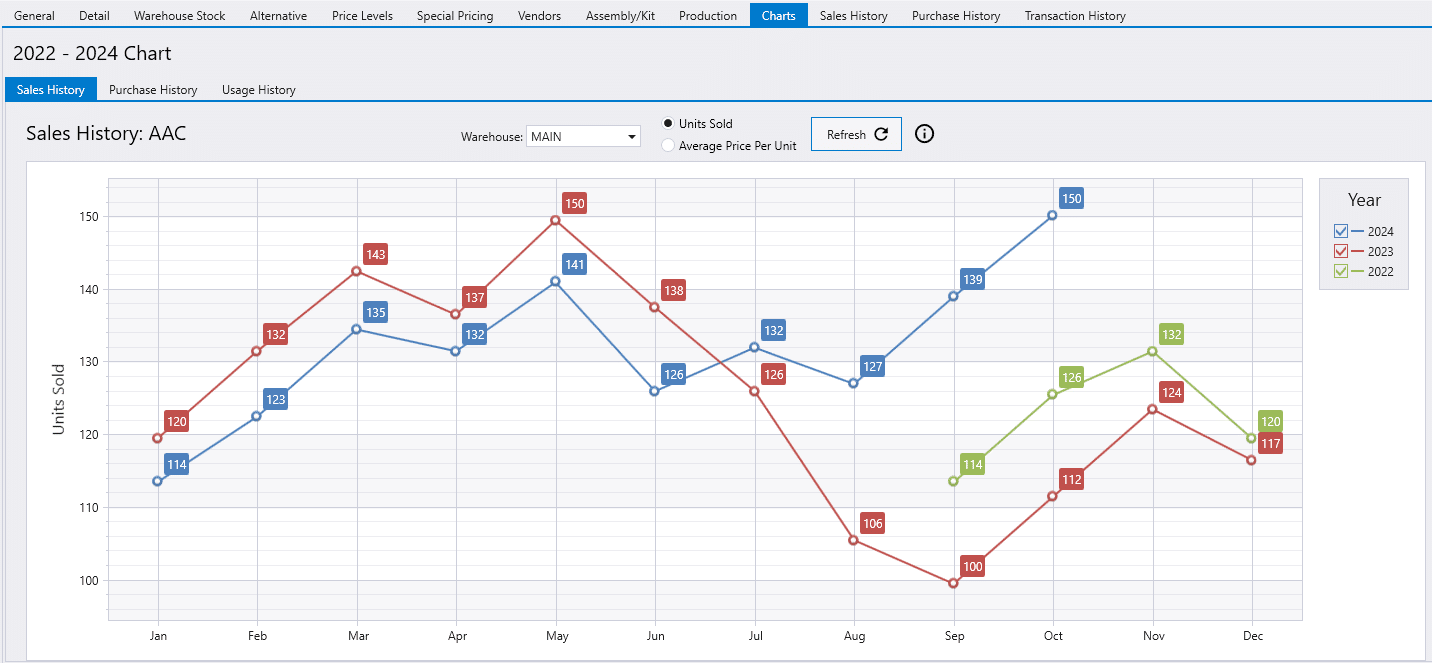
Inventory Item Charts
Charts can be found by opening an inventory item and going to the “Charts” tab. The chart will show up to 3 years of data.
- Sales History – Shows “Units Sold” or “Average Price Per Unit” for all posted invoices.
- Purchase History – Shows “Units Received” or “Average Purchase Cost” for all posted or received vouchers.
- Usage History – Shows “Units Sold” for all posted Build Assemblies, Credit Memos, Finance Charges, General Assemblies, Invoices, and VAMs.
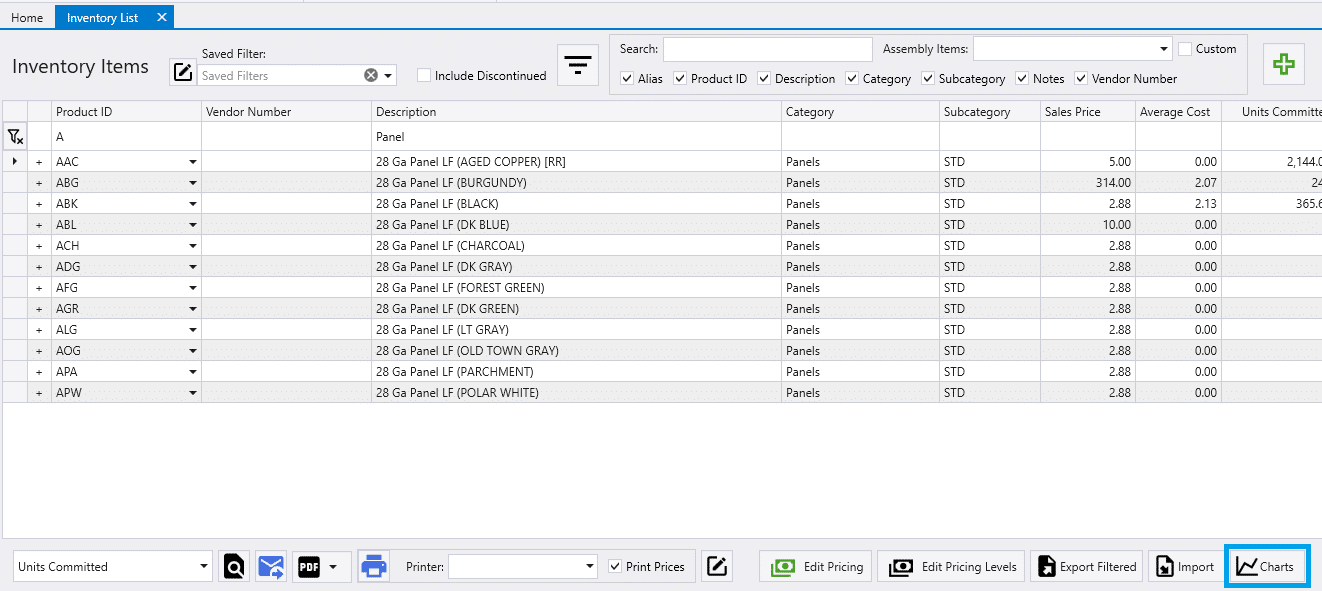
Inventory List Charts
Charts from the inventory list can be used to generate a chart for the list of items that the inventory list is filtered to. Up to 2,000 product IDs can be included when running the chart.
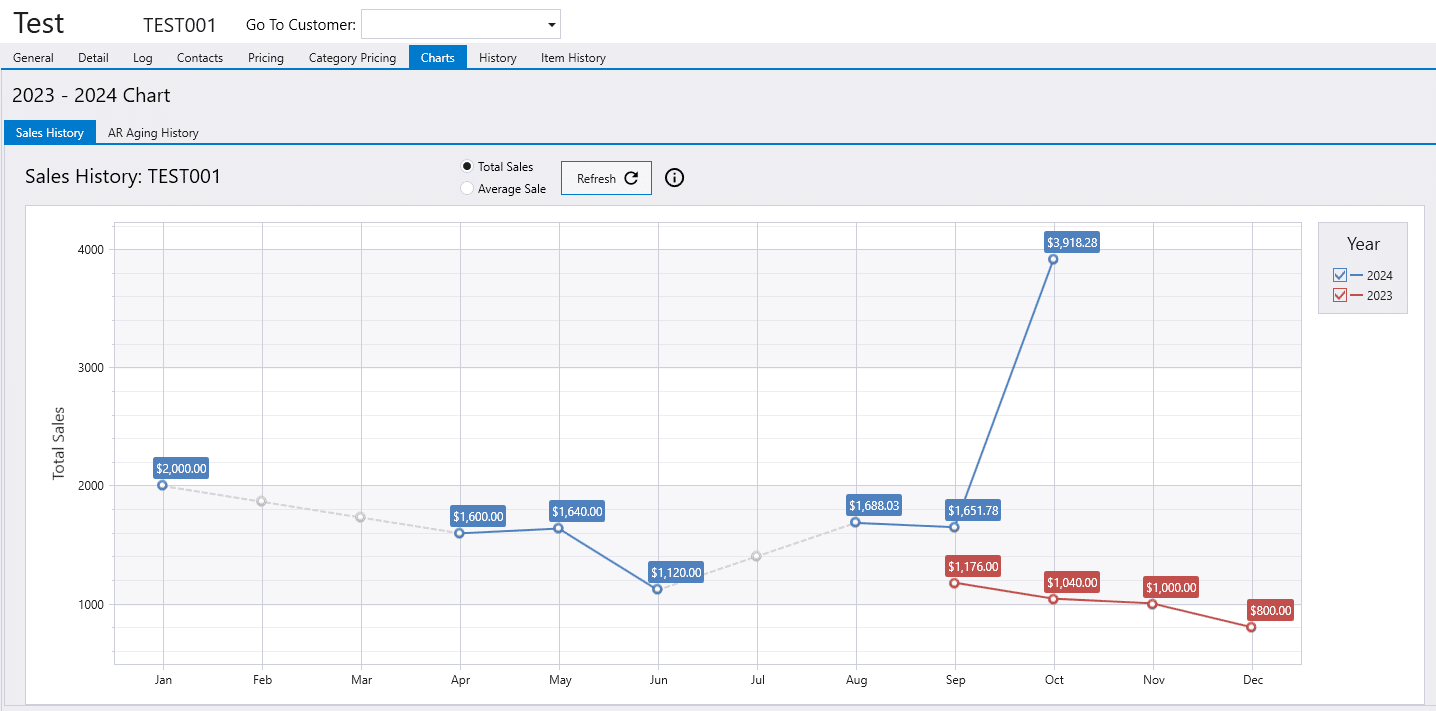
Customer Charts
Customer charts can be found by opening a customer and going to the “Charts” tab. The chart will show up to 3 years of data.
- Sales History – This chart shows “Total Sales” or “Average Sale” for all posted invoices for this customer.
- AR Aging History – This chart shows “Ending Balance” or “Change in Balance” for all posted invoices for this customer.
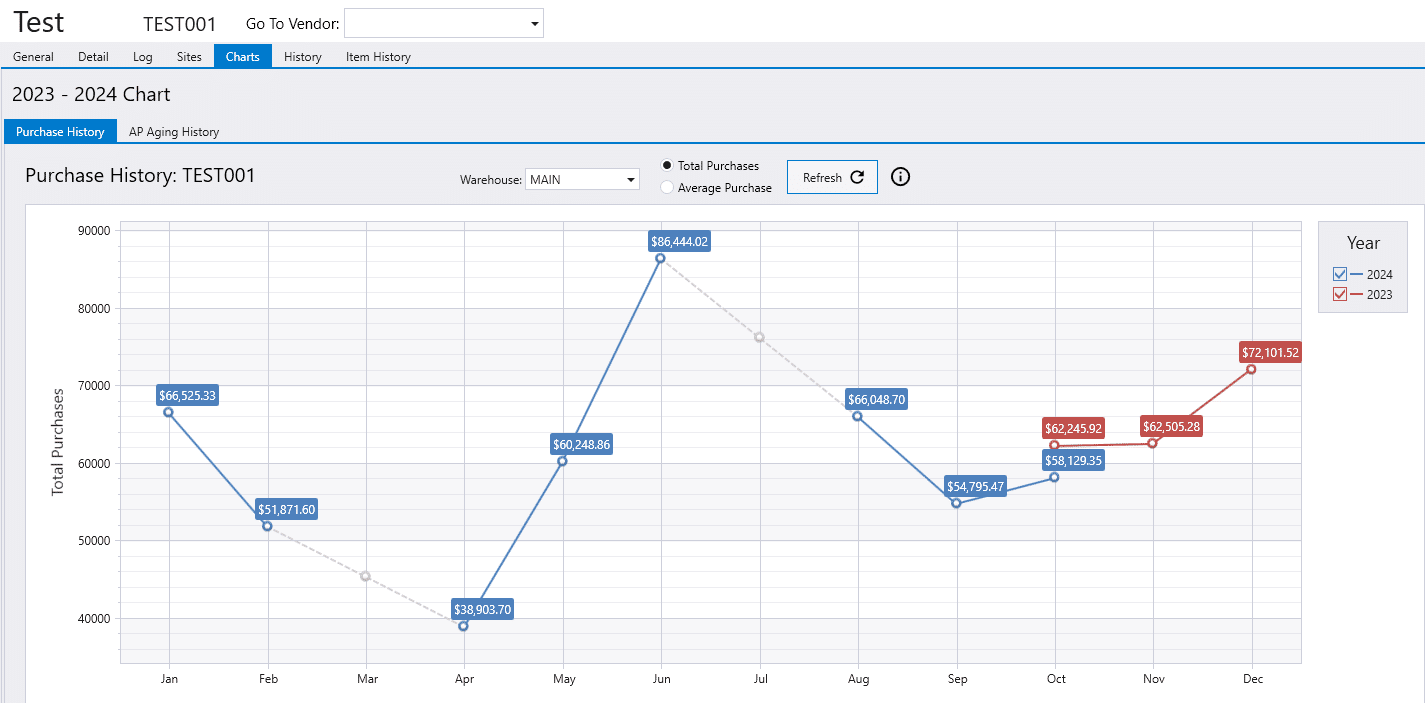
Vendor Charts
Vendor charts can be found by opening a vendor and going to the “Charts” tab. The chart will show up to 3 years of data.
- Purchase History – This chart shows “Total Purchases” or “Average Purchase” for all posted vouchers for this vendor.
- AP Aging History – This chart shows “Ending Balance” or “Change in Balance” for this vendor.